
Feasibility
Available onDeveloper
The feasibility is the spreadsheet you used to keep for every site, with two differences: the build cost is your real estimate, and every line has a date as well as an amount — which is what makes NPV, IRR and the interest bill mean anything.
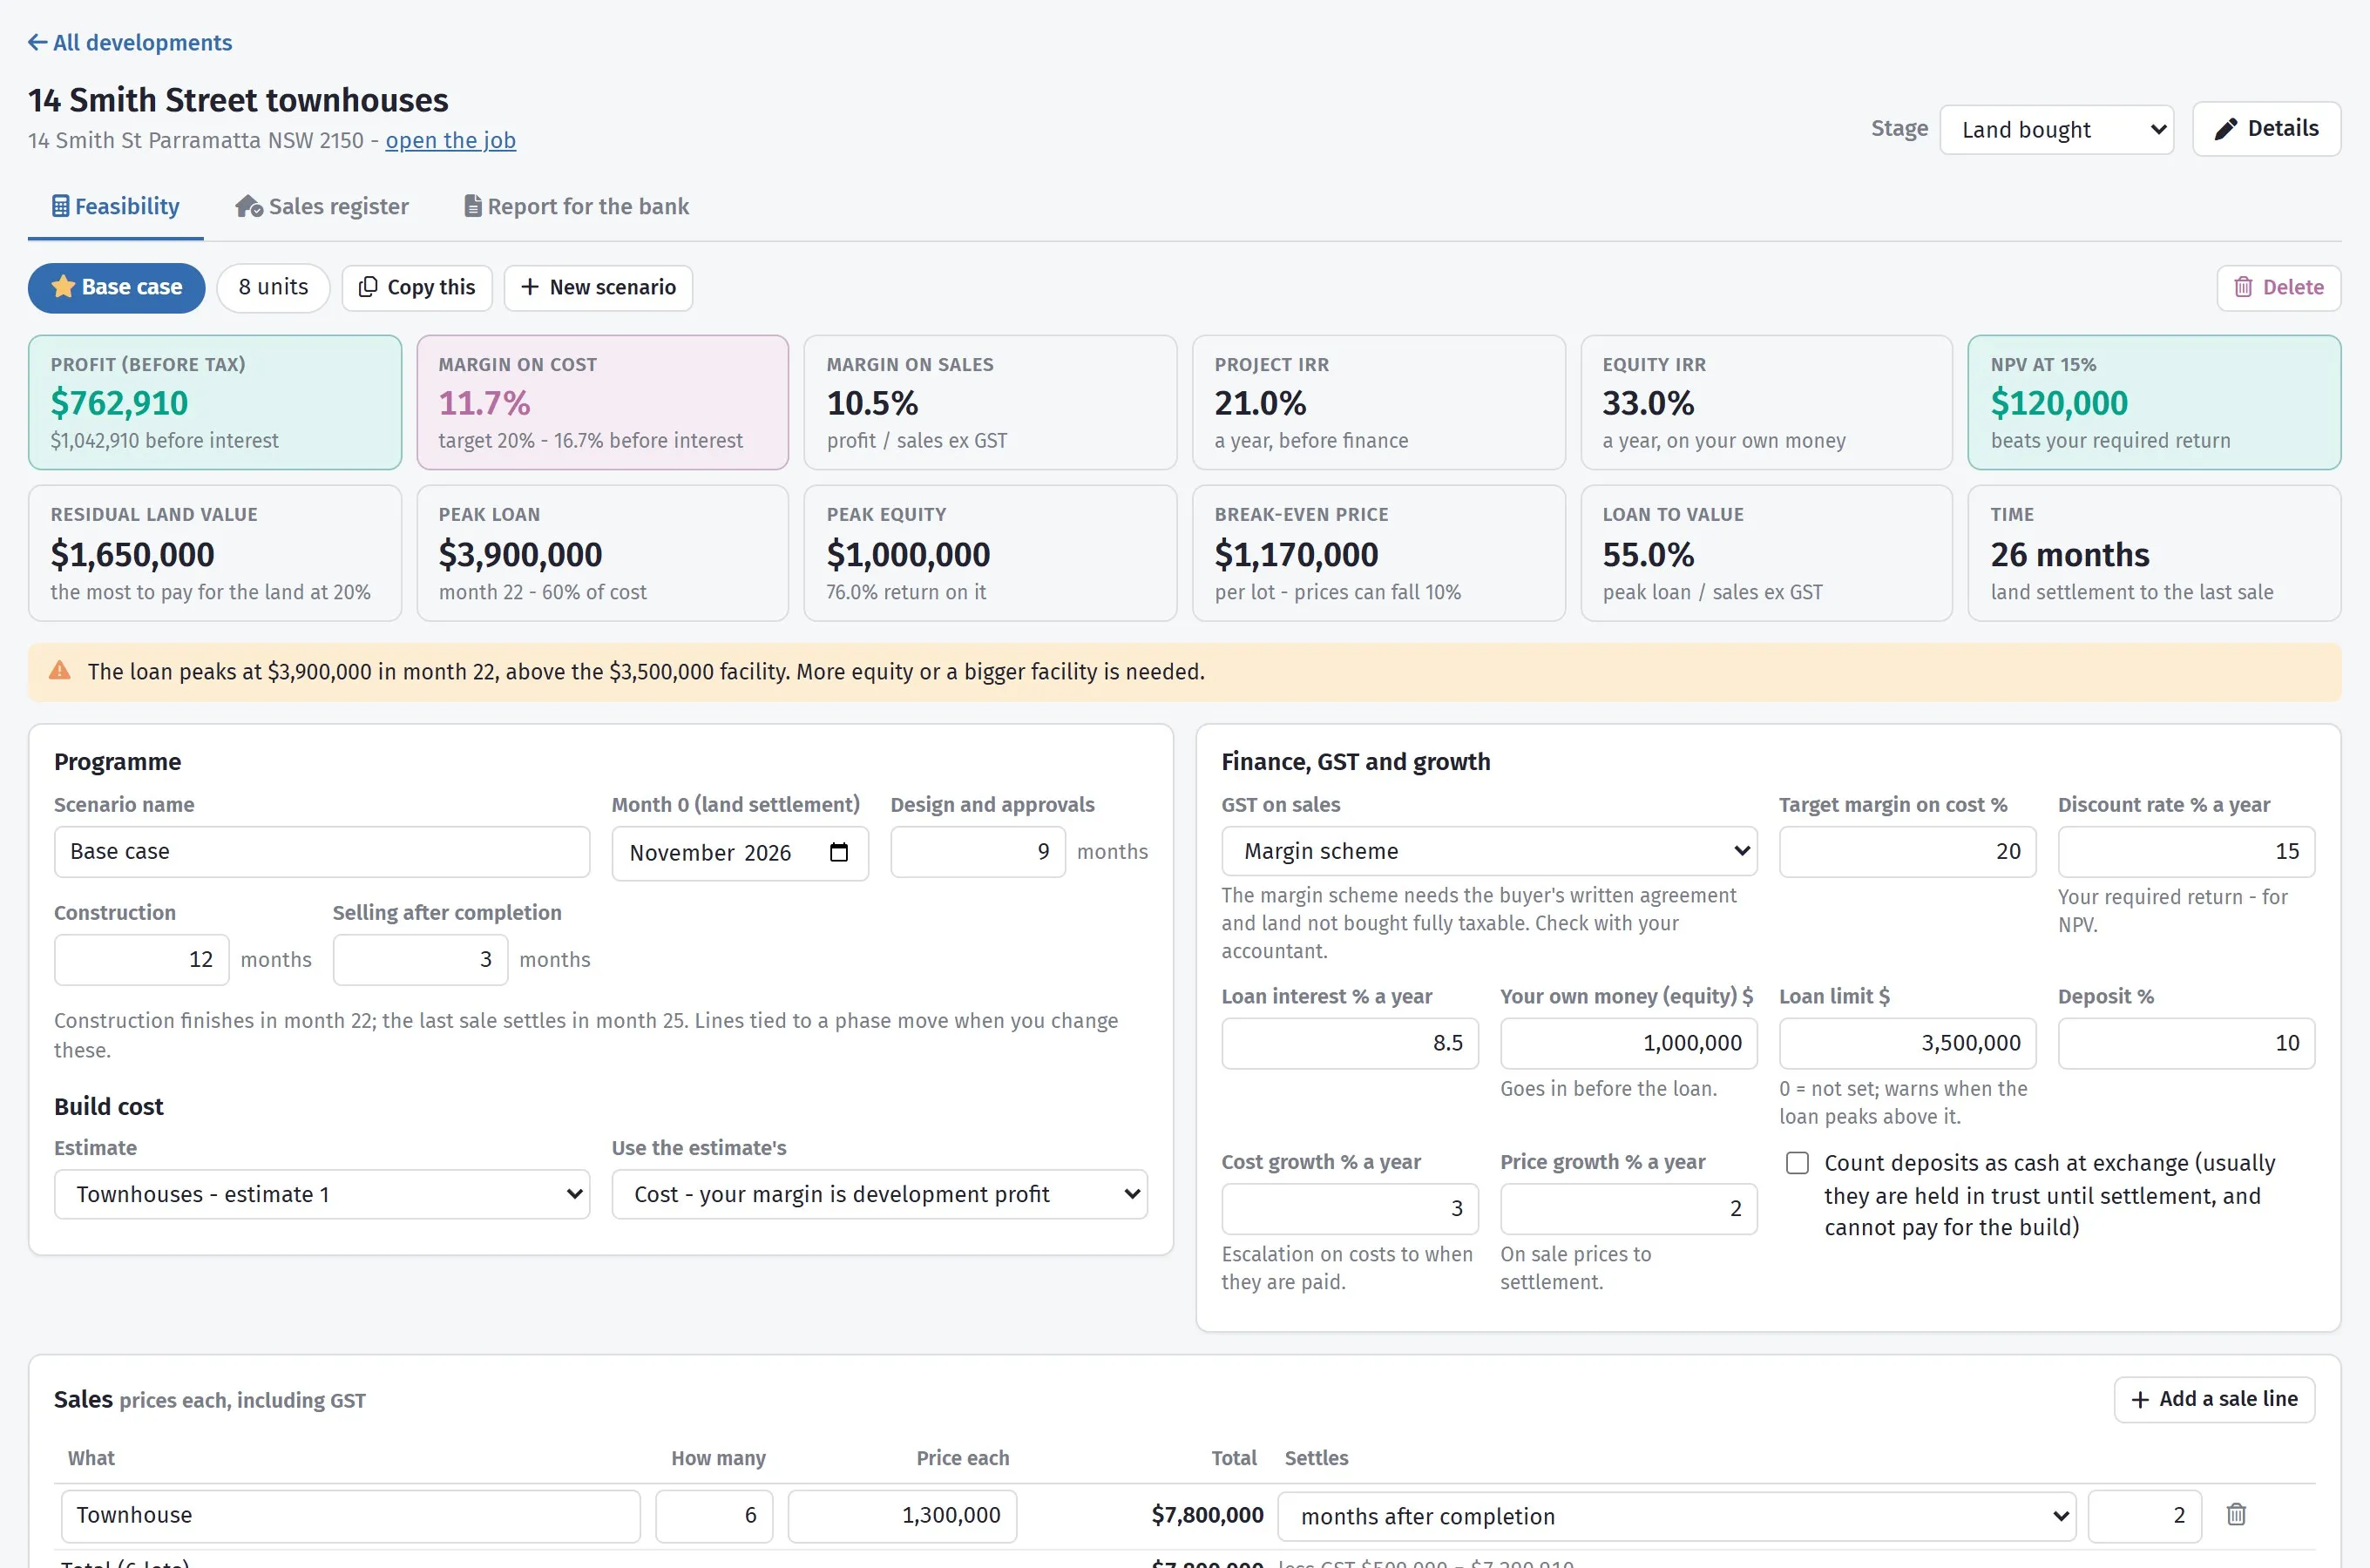
Scenarios down the side, the twelve tiles across the top, and the settings underneath.
Scenarios
Section titled “Scenarios”One development, several ways to build it. Six townhouses or eight units. Sell them all, or keep two.
Each scenario is a complete feasibility of its own. Copy takes the one you are looking at and changes one thing; New starts empty; the one you mark as chosen is the one the developments list and the bank report use.
Compare them on the numbers rather than on a hunch — eight units usually beats six townhouses on profit and loses on margin, and the loan tells you whether you can afford the difference.
The programme
Section titled “The programme”Everything else hangs off these.
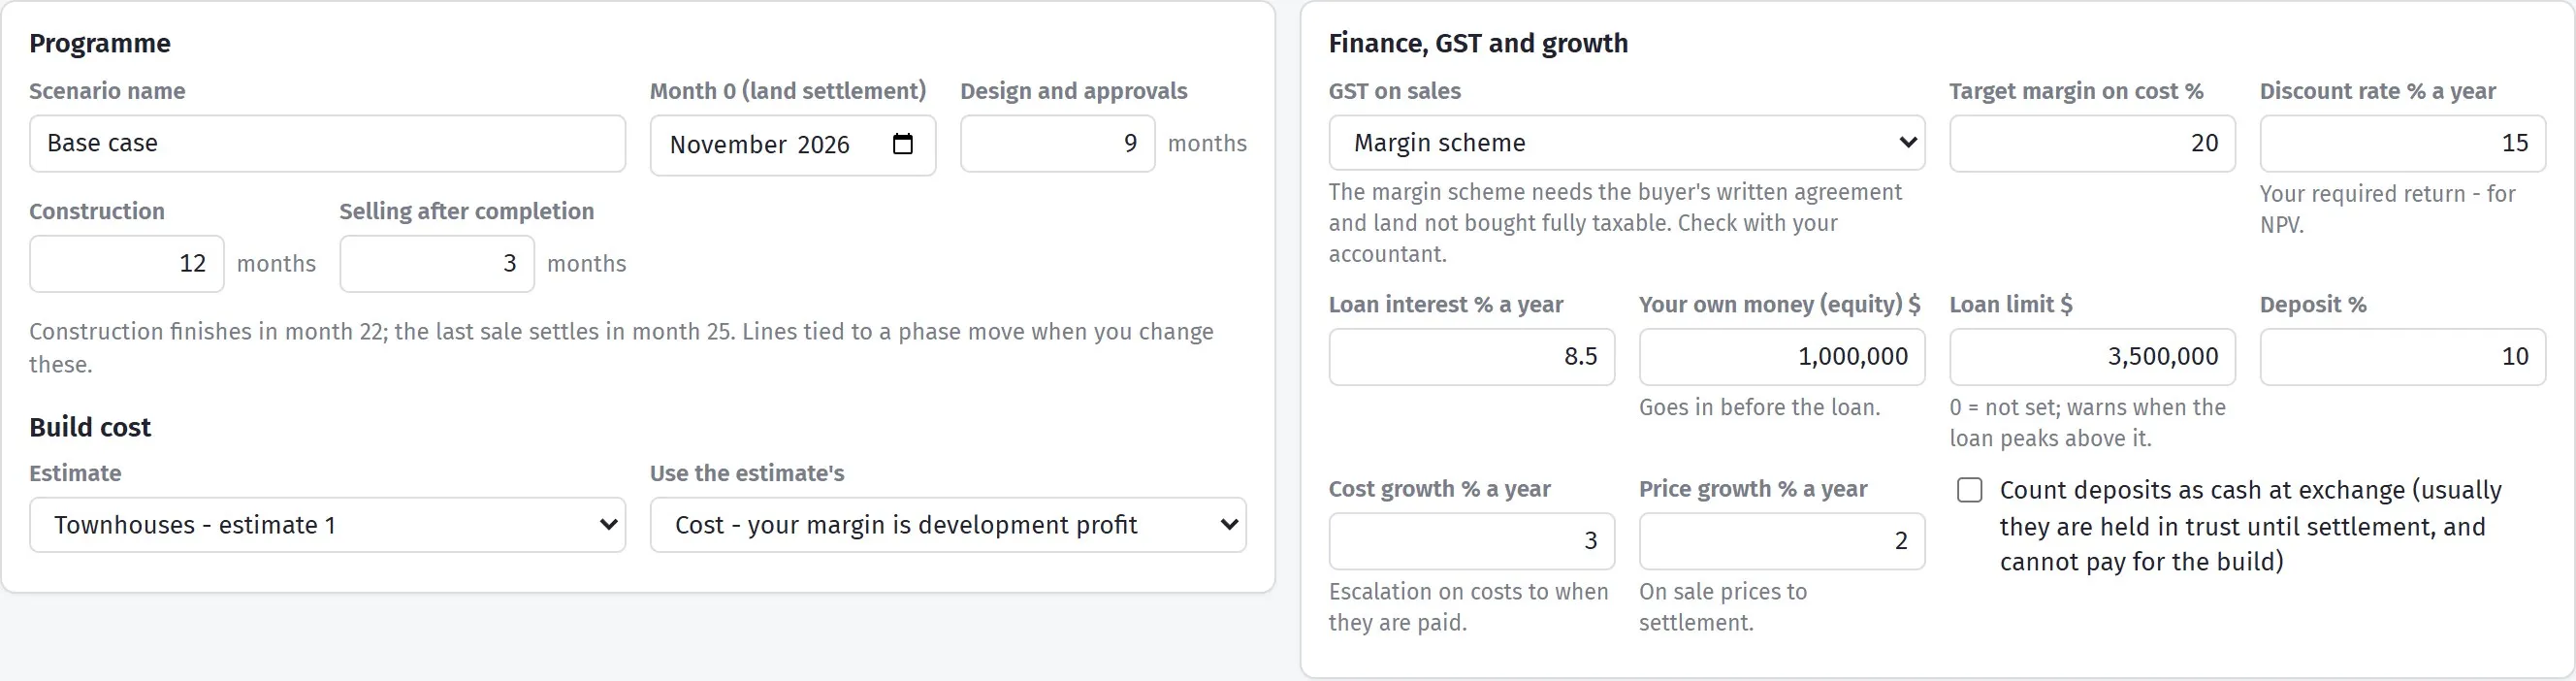
Change the construction months and everything after them moves.
| Field | What it means |
|---|---|
| Month 0 (land settlement) | The day the clock starts. Every other month counts from here |
| Design and approvals | Months from settlement until you can start building |
| Construction | Months of building |
| Selling after completion | Months from finishing to the last settlement |
Change the construction months and everything after it moves — the sales, the holding costs, the interest. That is the point of putting time in: a project three months late is a different project, and here you can see how much.
Where the build cost comes from
Section titled “Where the build cost comes from”The Construction line is linked to an estimate and reads Taken from the linked estimate. Two choices:
- at cost — what the job costs you to build. The normal choice when you are the builder and the profit is the development profit.
- at sell price — what you would charge a client. Use this when the development is to be built by someone else, or when you want the builder’s margin shown separately from the developer’s.
Before you have an estimate, type a figure in. Link it later and it goes live — change the estimate and the feasibility follows.
Cost lines
Section titled “Cost lines”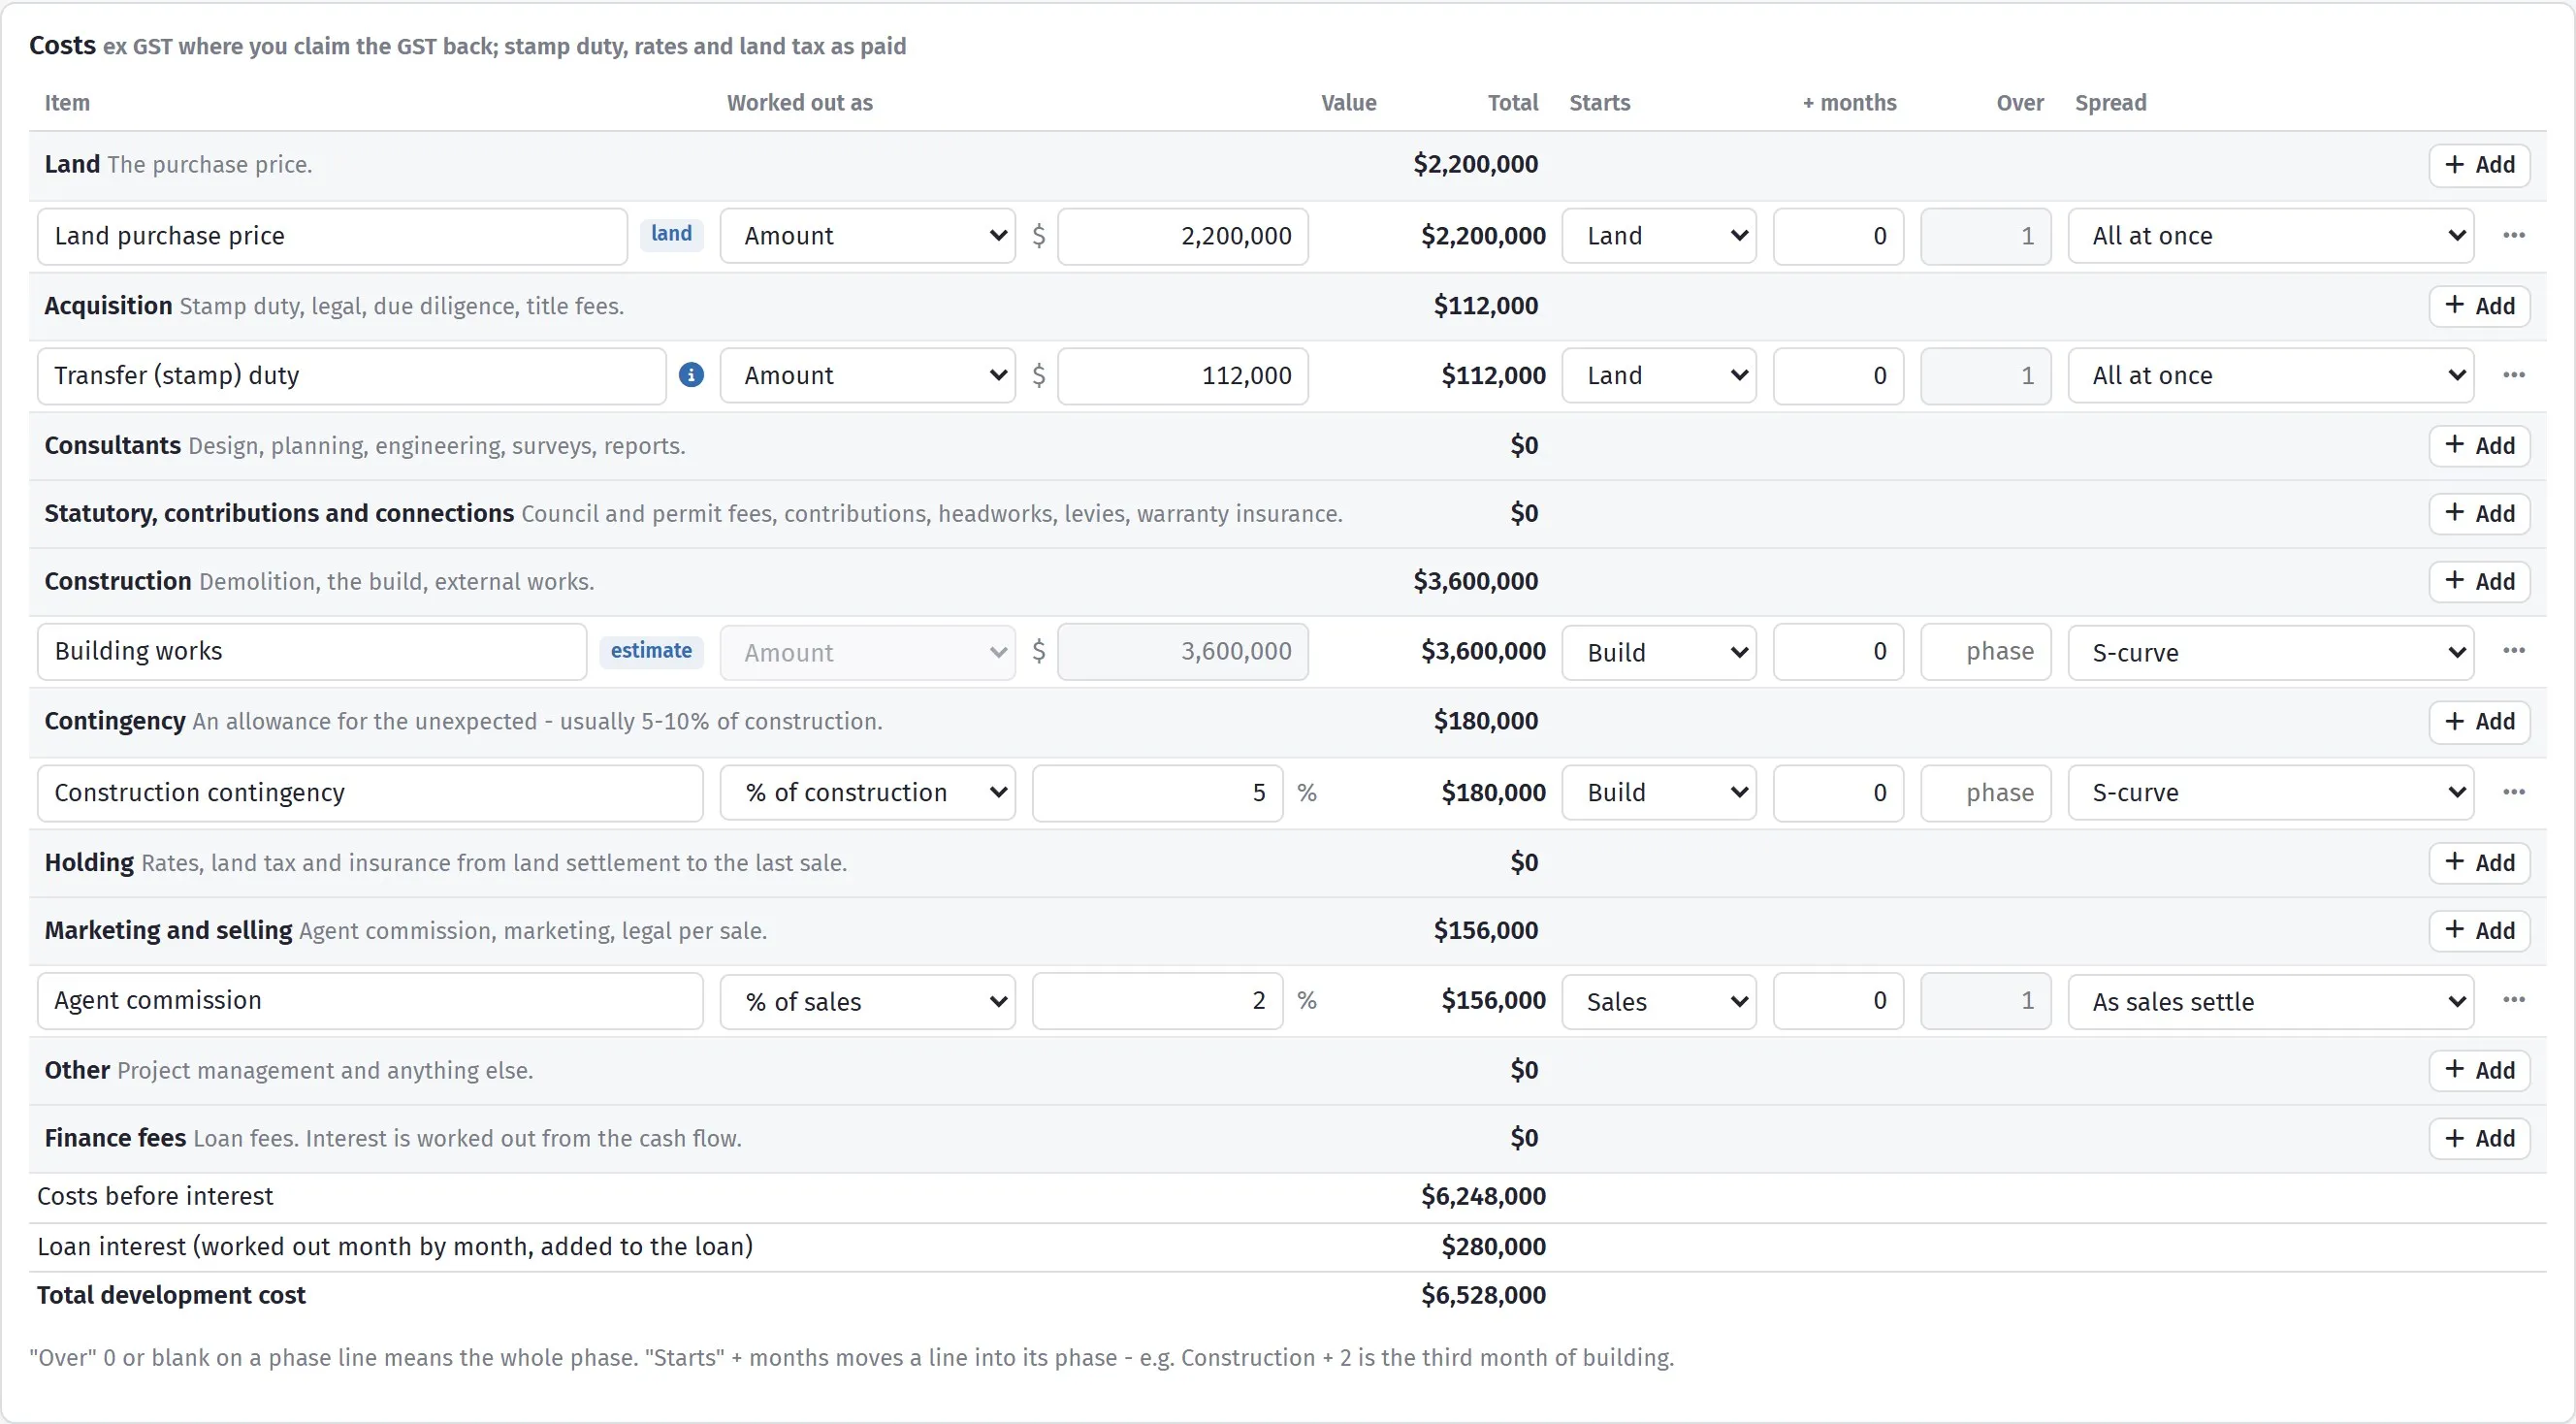
Every line carries how it is worked out and when it is paid.
Lines sit in ten sections, each with its own running total, and + Add puts another line in any of them:
| Section | What belongs in it |
|---|---|
| Land | The purchase price |
| Acquisition | Stamp duty, legal, due diligence, title fees |
| Consultants | Design, planning, engineering, surveys, reports |
| Statutory, contributions and connections | Council and permit fees, contributions, headworks, levies, warranty insurance |
| Construction | Demolition, the build, external works |
| Contingency | An allowance for the unexpected — usually 5–10% of construction |
| Holding | Rates, land tax and insurance, from land settlement to the last sale |
| Marketing and selling | Agent commission, marketing, legal per sale |
| Other | Project management and anything else |
| Finance fees | Loan fees. The interest itself is worked out from the cash flow, not typed |
Underneath them: costs before interest, then loan interest, then total development cost.
Enter costs ex GST where you claim the GST back, and stamp duty, rates and land tax as you actually pay them. The heading on the Costs card says the same thing, because it is the mistake that quietly skews a feasibility by a tenth.
Worked out as
Section titled “Worked out as”| Basis | Use it for |
|---|---|
| Amount | A figure you know. Council fees, a survey |
| Quantity x rate | Anything per unit of something. 6 lots at $3,200 |
| % of construction | Contingency, builder’s margin |
| % of sales | Agent commission, marketing |
| % of land price | Stamp duty, legal on purchase |
| Per lot | Anything charged per dwelling — connections, titles |
A percentage line follows whatever it is a percentage of. Push the build cost up and the contingency, the margin and the interest all move with it, which is exactly what happens in real life.
When it is paid
Section titled “When it is paid”A cost that lands in month 2 costs you more interest than the same cost in month 20. Each line carries:
| Column | What it does |
|---|---|
| Starts | Which phase the line belongs to — Land, Approvals, Build or Sales |
| + months | Pushes it that many months past the start of its phase |
| Over | How many months it is spread across. 0 or blank on a phase line means the whole phase |
| Spread | How it falls across those months |
The spreads:
| Spread | What it does |
|---|---|
| All at once | The whole amount in one month |
| Evenly | The same each month |
| S-curve | Slow, then fast, then slow — how building money actually goes out |
| As sales settle | Follows the settlements, not the calendar. Agent commission belongs here |
| Every month to the last sale | Rates, insurance — anything you pay until the last one is gone |
| Once a year (tax bill) | One bill per assessment date while you hold the land, paid about two months later. What land tax actually does |
The land price line
Section titled “The land price line”Mark the line that is the land price — it then carries a small land tag, the same way the construction line carries an estimate tag when it is linked to one. SmarteBuild needs to know which one it is to work out the residual land value — the most you could pay and still hit your target margin. It is also the base for every “% of land price” line, so stamp duty follows it when you test a lower offer.
Suggested figures
Section titled “Suggested figures”Most cost lines can suggest their own number, so a feasibility on a site you saw this morning is a few minutes’ work rather than an afternoon with a calculator and seven revenue-office websites.
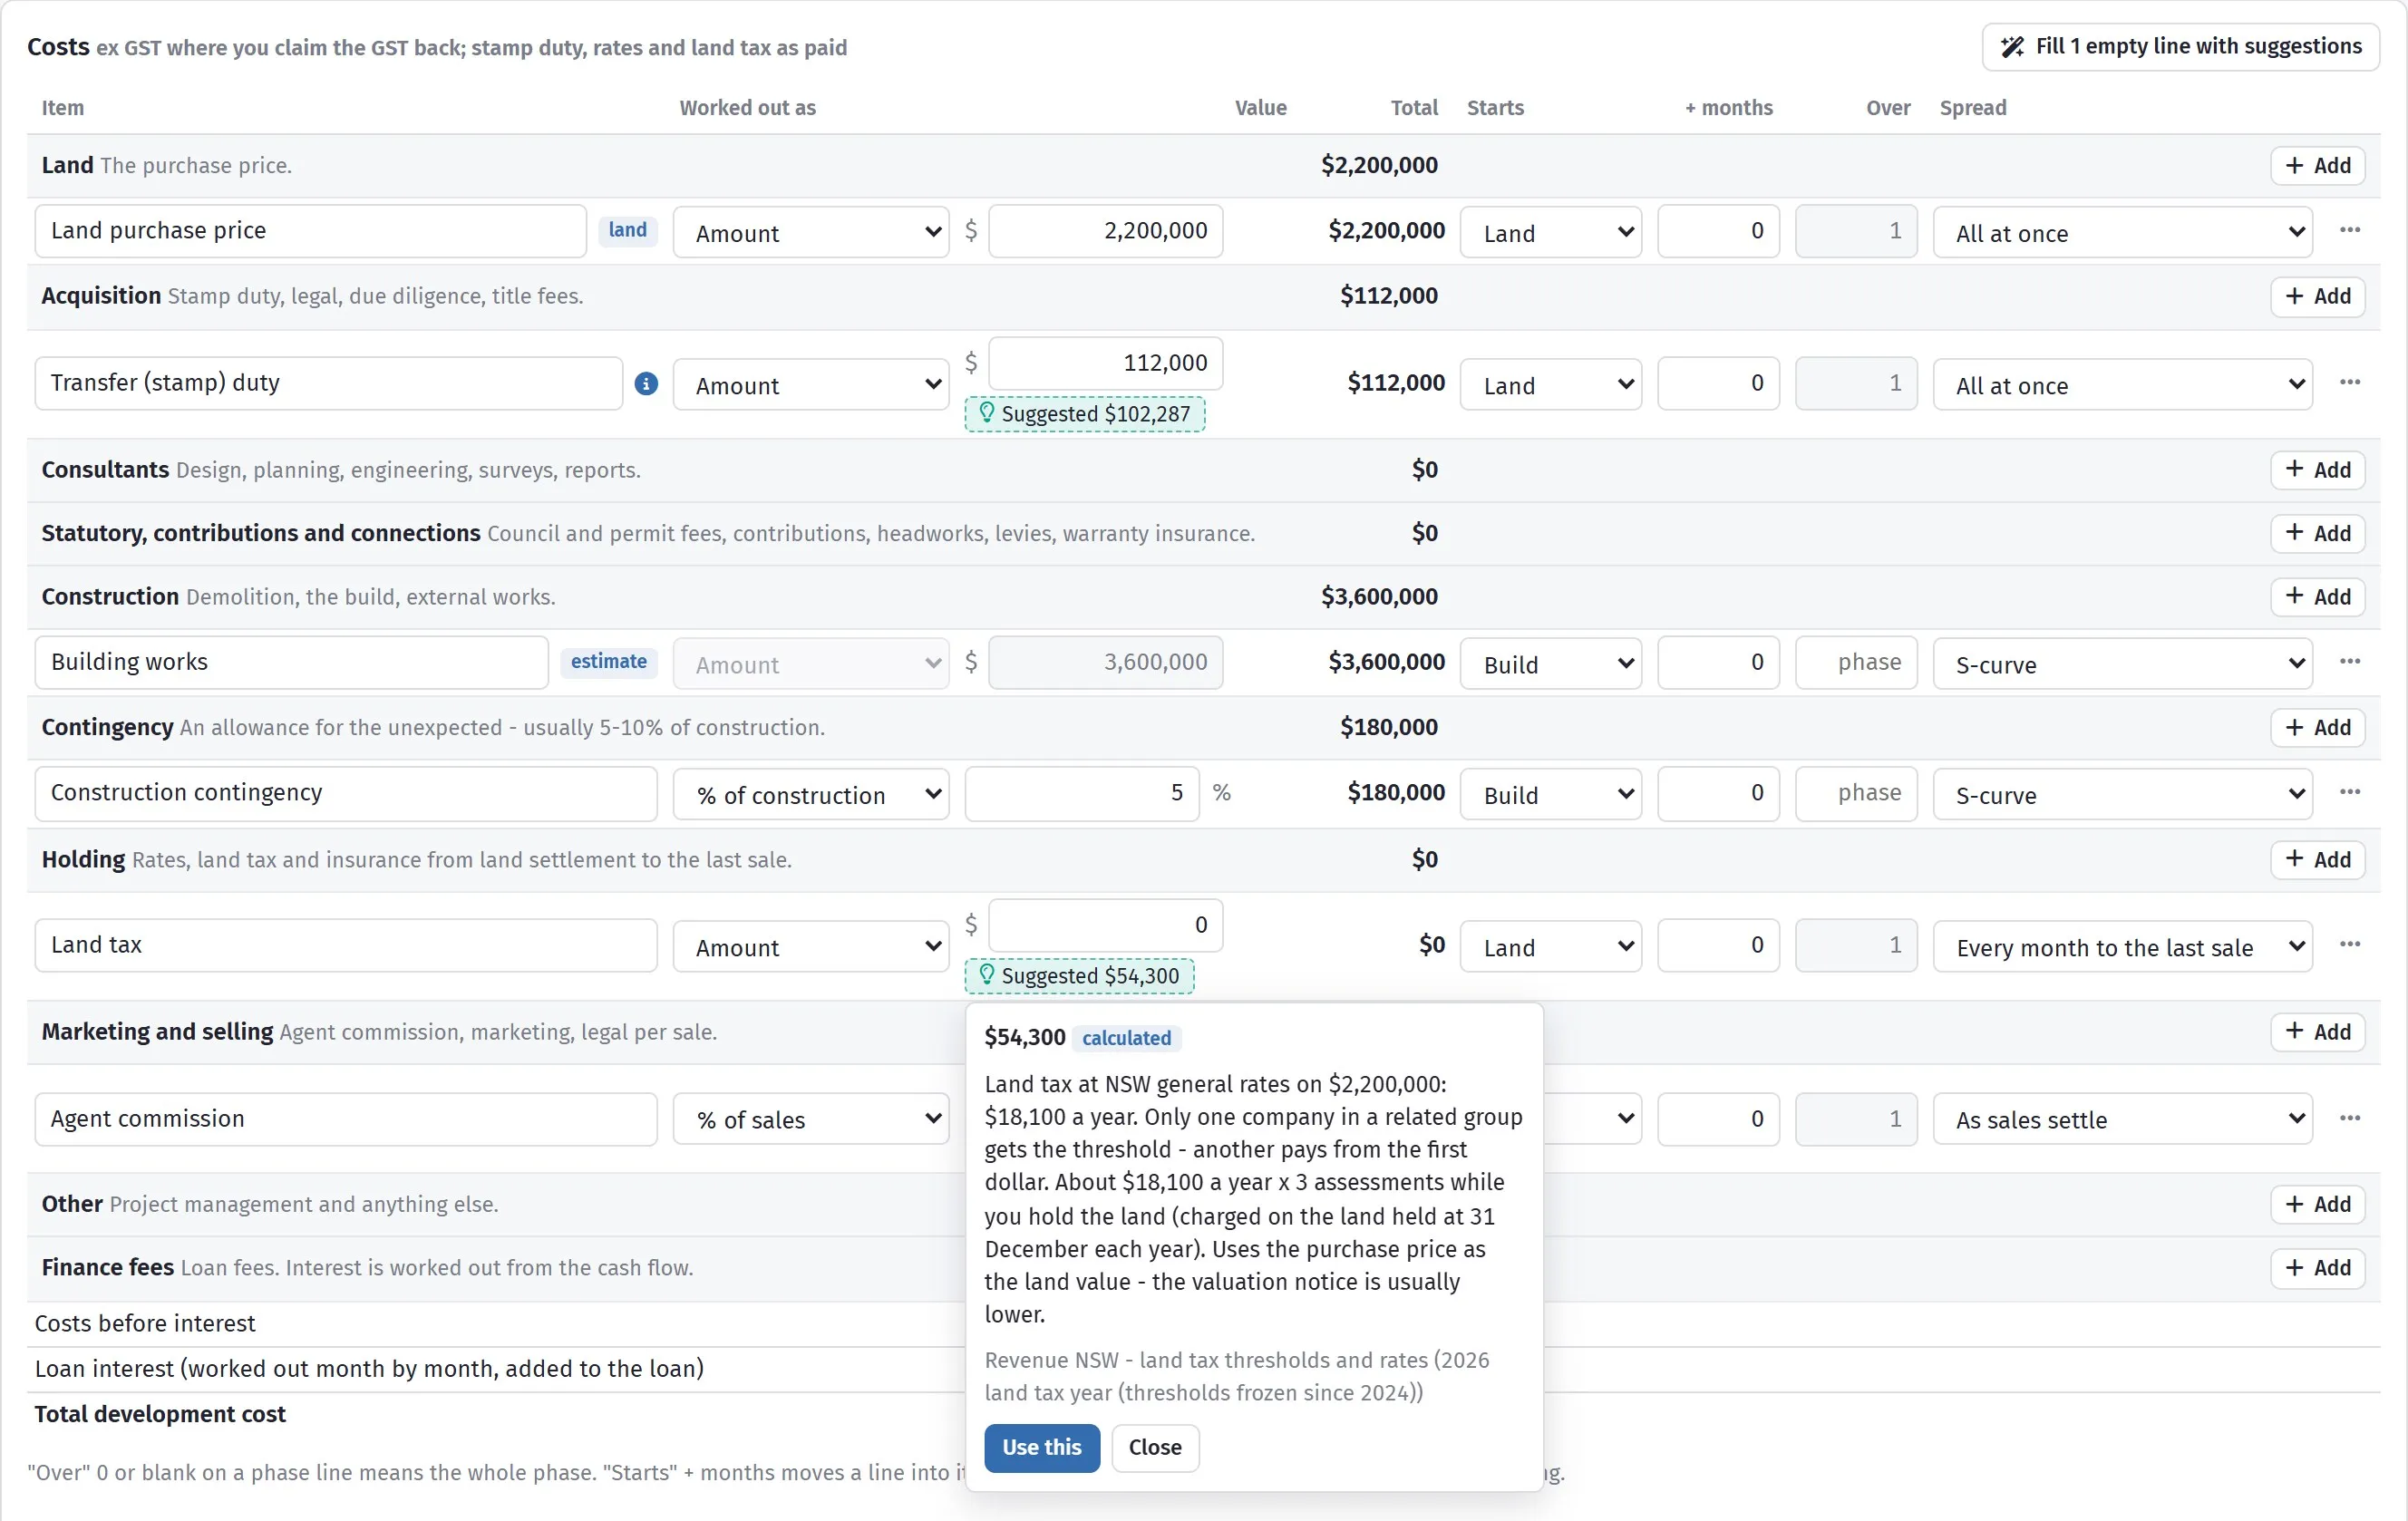
The working, the source and the date it was checked — then Use this, or Close.
Under a line’s value a chip appears. Which one you get tells you how much to trust it:
| Chip | What it is |
|---|---|
| Suggested $44,756 (teal) | Worked out from your state’s published rates |
| Typical $54,000 (yellow) | A rule of thumb — what this line usually comes to |
Click the chip and a panel opens beside it showing how the figure was reached, where the rate came from and when it was checked. Use this puts it in the line; Close leaves the line alone. It opens upwards when there is no room below, and closes if you scroll. A line you have taken a suggestion for is marked suggested figure with a tick, so you can see at a glance which numbers are yours and which came from here.
Fill N empty lines with suggestions, in the Costs heading, does the lot in one go. It only touches lines still at $0 — nothing you have typed is changed. Use it on a brand new feasibility, then work down and replace the ones you have real quotes for.
What is calculated
Section titled “What is calculated”Two lines are worked out properly from your state’s rates rather than guessed:
Transfer (stamp) duty at the state’s general investor rates. It does not include home-buyer concessions, because a development site does not get them. Foreign purchaser surcharges are added when you tick the box.
Land tax, which is the harder one and the one people most often leave out. It is not the tax on this land alone — it is the extra tax this land adds on top of whatever else you already own in that state, because land tax is worked out on your holdings together. Then it is multiplied by the number of assessment dates that fall while you hold the land:
| Assessment date | |
|---|---|
| NSW, VIC | 31 December |
| QLD, WA, SA | 30 June |
| TAS | 1 July |
| ACT | charged per residential property, on its own |
| NT | no land tax |
Hold a site over two 31 Decembers in NSW and you pay it twice. That is the figure that quietly ruins feasibilities, and it is why the programme months matter here as well.
Land tax and stamp duty
Section titled “Land tax and stamp duty”For either figure to be right, the Land tax and stamp duty box in the Finance card needs four things:
| Field | Why it is asked |
|---|---|
| Who owns the land | A company, Individuals or A trust — the scales differ |
| Other land you own in this state $ | Land tax is worked out on all of it together |
| Land value for land tax $ | Blank uses the purchase price. Fill it in if you have a valuation |
| Foreign buyer or owner | Adds the surcharges that apply |
What is a rule of thumb
Section titled “What is a rule of thumb”The rest are typical figures, not calculations: contingency at 5%, consultants as a percentage of construction by discipline, agent commission at your state’s usual rate, marketing at 1% of sales, legals at $1,500 a sale, development management at 2%, a loan establishment fee of 1%, and the NSW and QLD development contributions for new dwellings.
Council rates get no suggestion. Every council sets its own and there is no honest rule, so that line is left for you to look up.
Sale lines
Section titled “Sale lines”
What you expect each lot to fetch, until the sales register has real prices.
Per scenario, because it can genuinely differ:
| Choice | When |
|---|---|
| Full GST | One eleventh of each sale price goes to the ATO |
| Margin scheme | GST on the margin only — the sale price less what the land cost — which is usually far less |
| None | Not a taxable supply |
A GST on sales figure shows what the choice costs, so you can see the difference between the two in a few seconds.
GST timing and the bank’s limits
Section titled “GST timing and the bank’s limits”Two things that decide whether a feasibility is fundable, rather than merely profitable.
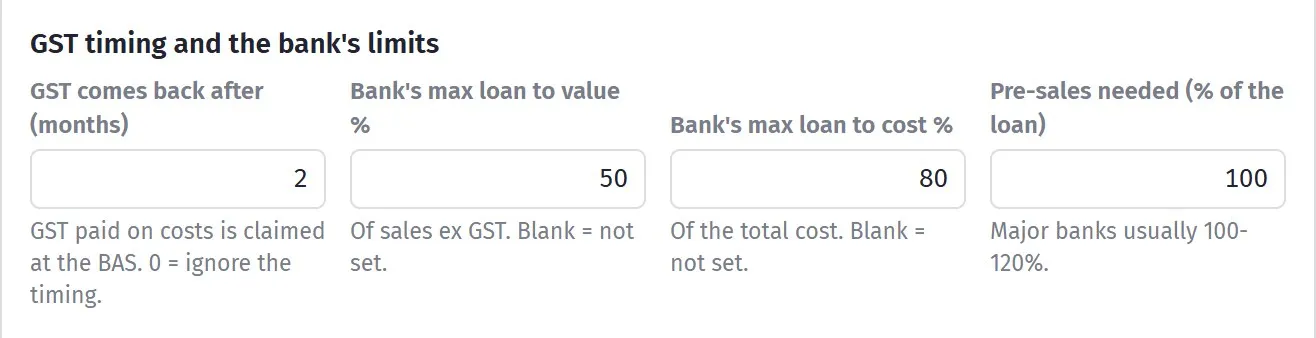
Four fields, each with its own hint. Leave a bank limit blank and that limit is simply not applied.
When the GST comes back
Section titled “When the GST comes back”GST on your costs is money you lay out and get back at the BAS — but not in the same month, and in the meantime the bank is lending it to you.
- Each cost line’s menu has GST is paid on it (claimed back at the BAS). It is on by default except for land, duty, council fees and holding costs, which generally do not carry it.
- GST comes back after (months) is how long your refund takes. Two is the usual answer for a quarterly BAS. Set it to 0 to ignore the timing altogether and treat costs as GST-free.
The cash flow then carries a GST paid / claimed back row, so you can see the money going out and coming back rather than netting it off and pretending it was never gone. On a $6M project that timing difference is real interest.
Under the margin scheme, the buyer withholds 7% of the price and pays it to the ATO at settlement; it is squared up at your next BAS. SmarteBuild shows it that way round rather than assuming you receive the full price.
What the bank needs
Section titled “What the bank needs”Set the three limits your lender works to and a What the bank needs card appears:
| Field | What it is |
|---|---|
| Bank’s max loan to value % | Against sales ex GST |
| Bank’s max loan to cost % | Against the total development cost |
| Pre-sales needed (% of the loan) | Major banks usually ask for 100–120% |

Pink where you are short of what the bank would want.
The card answers the three questions a lender’s first phone call asks:
- Most they would lend — the lower of their two limits
- Your own money needed — total cost less that, and how far short you are
- Pre-sales needed — how many lots, and what they come to ex GST
The loan and your own cash
Section titled “The loan and your own cash”Your money goes in first, then the bank’s.
| Field | What it means |
|---|---|
| Loan limit $ | The facility. Peak loan tells you whether it is big enough |
| Loan interest % a year | Worked out monthly on the real running balance and added to the loan |
| Equity | Your own cash. Goes in before the loan |
Interest is capitalised — added to the balance each month, so you pay interest on the interest, as you do in life. That is far more honest than the “half the loan for half the time” rule most spreadsheets use, and it is usually the difference between a feasibility that works on paper and one that works at the bank.
Deposits
Section titled “Deposits”A 10% deposit at exchange is normally held in trust until settlement, so it is not your money yet. The Settlement timing switch decides whether the feasibility counts a deposit as cash when it is received or when the lot settles. Leave it on settlement unless you know your contracts release deposits early.
Growth
Section titled “Growth”| Field | What it does |
|---|---|
| Cost growth % a year | Escalation on costs to when they are paid. A cost two years out is not today’s cost |
| Price growth % a year | On sale prices to settlement |
Use both or neither. Escalating prices while holding costs flat is how feasibilities talk builders into sites they should have walked away from.
Comparing scenarios
Section titled “Comparing scenarios”With two or more scenarios, Compare appears on the scenario bar and opens Compare scenarios — one column each, side by side, on seventeen rows: Lots, Sales (inc GST), Land, Construction, Interest, Total development cost, Profit (before tax), Margin on cost, Margin on sales, Project IRR, Equity IRR, NPV, Peak loan, Peak equity, Residual land value, Break-even price per lot and Time.
Teal marks the best figure in each row. Nothing is marked where they are all the same. A margin shown in pink is under that scenario’s own target.
This is where six townhouses against eight units stops being a feeling. The usual answer is that the bigger scheme wins on profit and loses on margin, and the honest question is whether the extra peak loan is one you can get and want to carry.
Each column has Open to switch to that scenario; the one you came from says open now.
Like the Excel file, it compares the scenarios as last saved — save before you compare, or you will be looking at yesterday’s version of the one you have been editing.
Locking a version
Section titled “Locking a version”Banks do not ask whether the job is going well. They ask how far it has moved from the feasibility they approved — at every drawdown. Lock as approved, on the Feasibility against today card, is how you answer that in one look.
Lock as approved opens Lock this version. Give it a Name — it starts as Approved by the bank — and a Note if the lock needs context, such as the lender and the loan reference. Lock it freezes the scenario as last saved, including that day’s estimate cost, so the record is what you actually sent. It warns you if there are unsaved changes.
After that the card shows three columns:
| Column | What it is |
|---|---|
| The locked version | What you froze, with its name and the date |
| This scenario | The feasibility as it stands now |
| Today | What has actually happened — spent, committed, sold |
Under every figure that has moved sits the difference from the locked version — teal where it has gone your way, pink where it has not. That is the drawdown conversation on one card: here is what you approved, here is where we are, here is the gap.
Locked versions (n) lists every lock, newest first, with a Remove on each. The card always compares against the most recent one, so lock again when the bank approves a revision.
Taking it to Excel
Section titled “Taking it to Excel”Excel, on the scenario bar, downloads the whole feasibility as a workbook — six sheets:
| Sheet | What is on it |
|---|---|
| Summary | The project in the bank’s order, with the measures and the assumptions |
| Costs | Every line, how it is worked out, when it is paid, and its total |
| Sales | The sale lines |
| Cash flow | One row a month: costs, sales, interest, loan balance, your own money |
| What if | The sensitivity grid |
| Sales register | Only for people allowed to see the register |
The figures are real numbers, not text, so you can build your own formulas on top of them — which is the point. Take it to a lender’s template, or test something the what-if grid does not cover.
What next
Section titled “What next”- The metrics — the twelve tiles, in plain words
- Cash flow and what-if — month by month, and what breaks it