
Cash flow and what-if
Available onDeveloper
The tiles are the answer. This is the working behind them.
The cash flow
Section titled “The cash flow”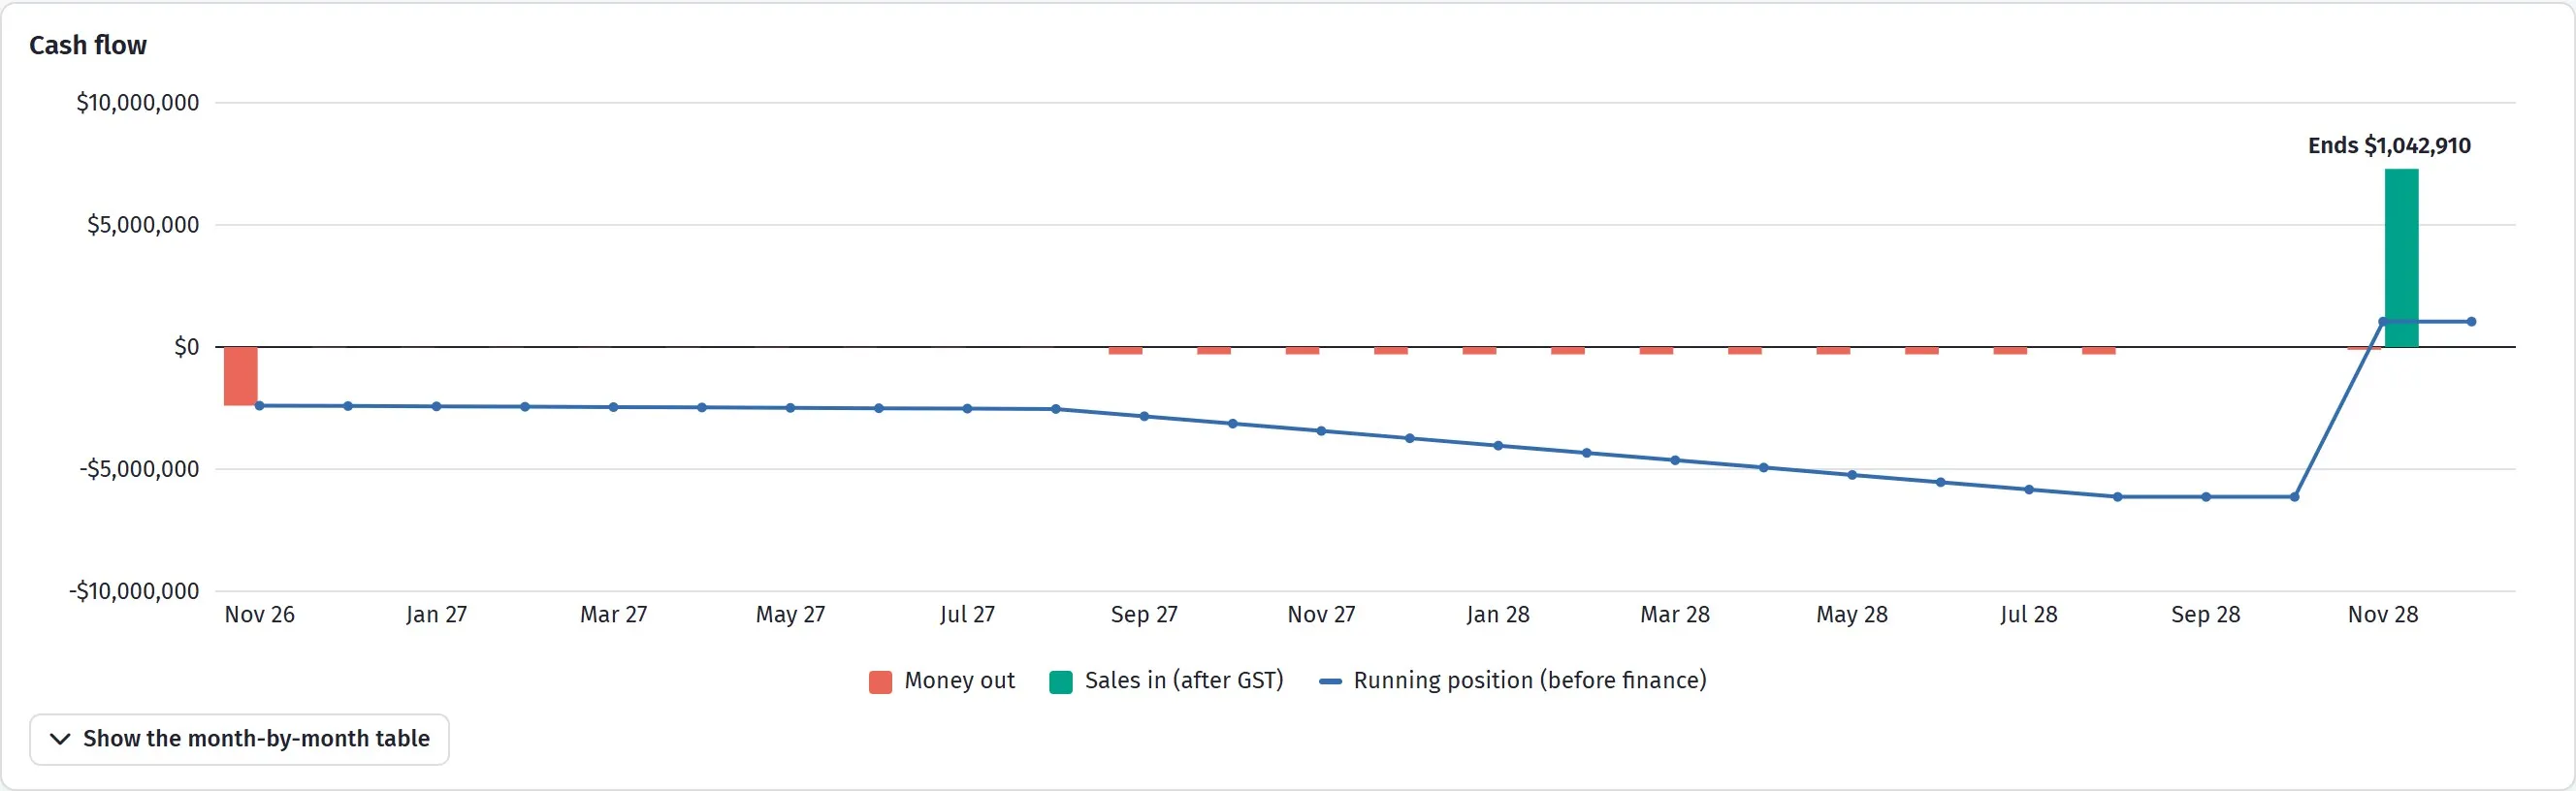
Two years out, then everything in. The closing figure sits above the last bar.
A chart and a month-by-month table, from month 0 to the last settlement.
| Column | What it is |
|---|---|
| Money out | Every cost falling in that month, after its spread |
| Money in | Sales settling, and deposits if you count them on exchange |
| Net | The month on its own |
| Running balance | Where the project stands |
| Loan balance | What the bank is owed, after your own cash has gone in first |
| GST paid / claimed back | GST out on costs, and back at the BAS a few months later |
| Interest | Worked out on that month’s real balance, and added to it |
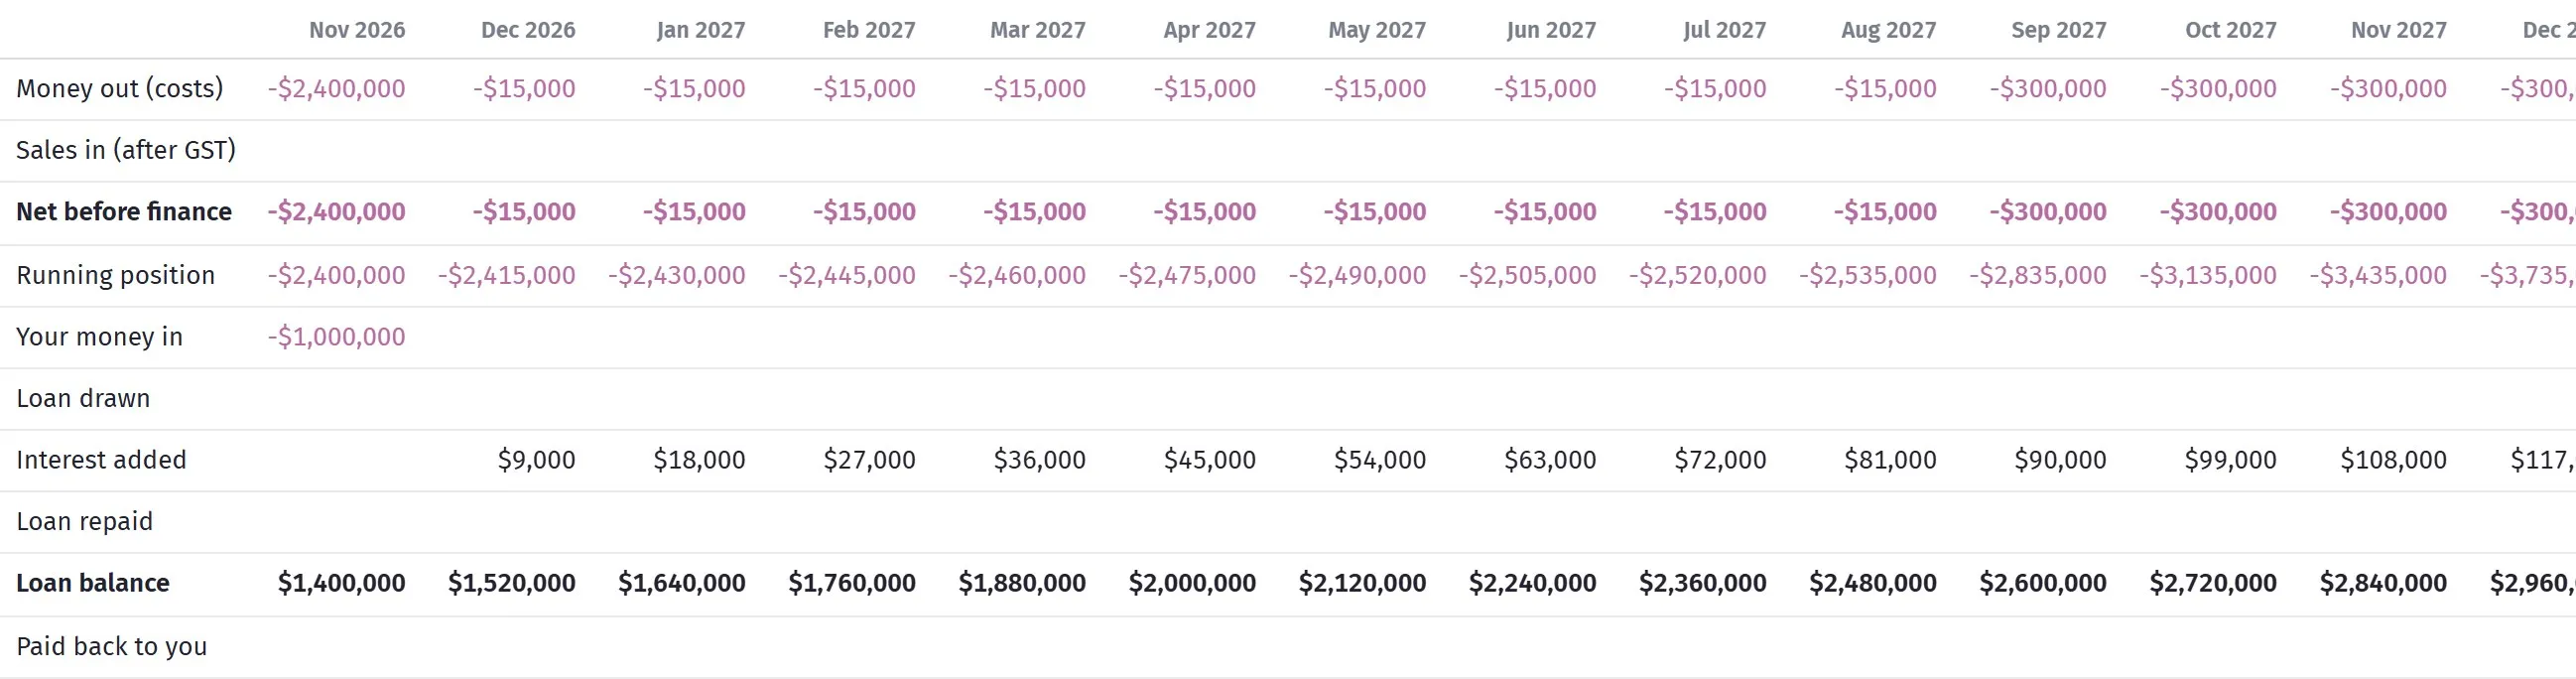
Every month: out, in, net, the running position, the loan and its interest.
Read it for the shape, not the detail. Almost every small development makes the same picture: money out for two years, nothing in, then everything in over a few months at the end. The deepest point of that trough is your peak loan, and the length of it is your interest bill.
Two things worth looking for:
- A trough deeper than your facility. The project is unfundable as drawn, however good the margin is.
- Sales bunched into one month. Settlements slip. If everything lands in month 26, one slow buyer moves your last payment and a month’s interest.
What-if
Section titled “What-if”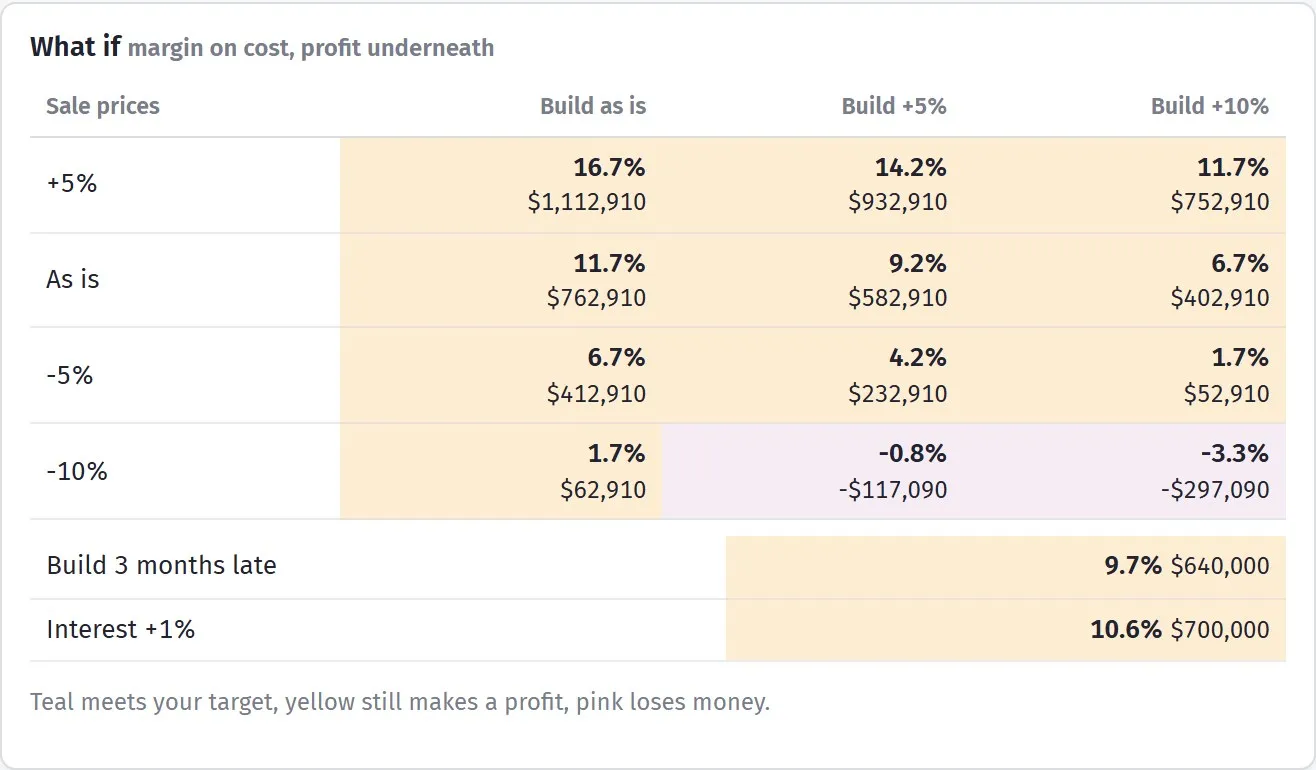
The same project under worse conditions, with no typing.
The grid runs the feasibility again under worse conditions and shows what survives:
- Sales down 5% and 10%
- Build cost up 5% and 10%
- Three months late, and six months late
- Interest up 1% and 2%
This is the most useful screen in the section, and it takes no typing. A site whose margin holds up at sales down 5%, build up 5% is a different proposition from one that goes red the moment anything moves — even if both show the same profit today.
Lenders ask for a version of this. Having it already run is a good look.
Feasibility against today
Section titled “Feasibility against today”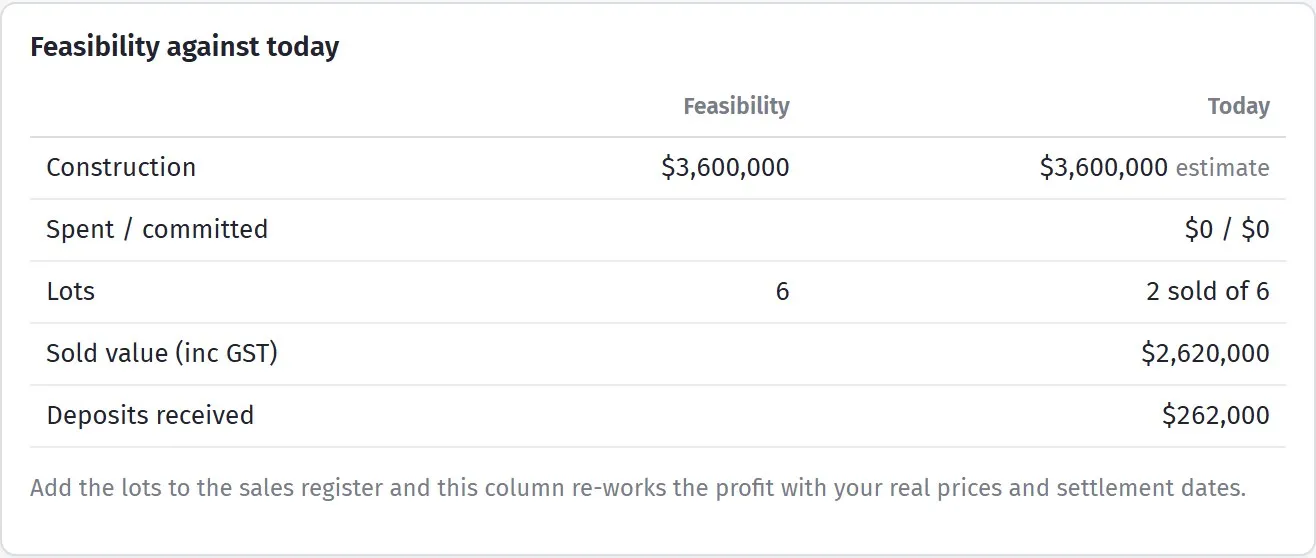
The forecast beside the real figures, once the job is running.
Once the job is running, a second column shows what has actually happened, beside what you assumed:
| Where it comes from | |
|---|---|
| Land | As bought |
| Build | The estimate’s budget, plus what is spent and committed — from your orders and invoices |
| Sales | As sold, from the sales register |
| Forecast profit | The feasibility re-run with today’s real figures |
This is the screen to open every week once you are building. The feasibility was a forecast; this is the score.
Pre-sale cover appears here too: how much of the loan is covered by exchanged sales. Lenders usually set a minimum before they will release construction funding, and watching it climb is how you know you are on track to draw down.